 40G/100G Optical Transceivers
 25G Optical Transceivers
 10G Optical Transceivers
 155M/2.5G Optical Transceivers
 1G Optical Transceivers
 1G BIDI Optical Transceivers
 Dual-Rate Optical Transceivers
 FC 16G/32G Optical Transceivers
 CWDM Optical Transceivers
 DWDM Optical Transceivers
 SGMII Port Optical Transceivers
 XFP Optical Transceivers
 100M/1G/10G Coppers
 Full-Rate AOC & Breakout Series
 10G/40G Active DAC Series
 Full-Rate Passive DAC Series
 40G/100G Passive Breakout DAC Series
 Regular/MTP-MPO Fiber Patch Cords
 MT2011
 MT2010
 CodingBox
 QSFP to SFP Adapter
Introduction Of Fiber Optic Patch Cords To Reduce Insertion Loss
Time: 2020-03-19
I. Lateral Misalignment and Insertion Loss
The main factors causing insertion loss of fiber optic connectors include lateral misalignment, end face gap, diameter mismatch and tilt connection. Domestic and foreign enterprises and research institutions have conducted in-depth experiments and quantitative engineering research. Today, the optical performance and repeatability of fiber optic connectors have been significantly improved: the insertion loss has decreased from the initial 0.5-1 dB to the current 0.2 dB; after 500 insertions and removals, the change in insertion loss can be controlled within 0.1 dB.
In fiber optic docking projects, the loss caused by lateral misalignment of fiber cores is called misalignment loss, which is the main source of insertion loss in fiber optic connections, especially for single-mode fibers. Without considering other factors, the connection loss caused by transverse fiber misalignment can be approximated as follows:
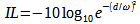
where d denotes the misalignment distance of the two butted fibers and ω denotes the spot distribution function. Figure 1 depicts the relationship between core transverse misalignment and insertion loss for a typical single-mode fiber (spot energy distribution is approximated as Gaussian):
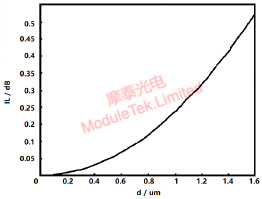
Figure 1 Relationship Between Transverse Misalignment Distance and Insertion Loss of Single-Mode Fiber Core
The transverse misalignment of fiber optic connector cores is determined by several factors, such as the concentricity between the inner hole and outer diameter of the ceramic ferrule, the concentricity between the curing position of the fiber core and the ferrule hole, and the positional deviation in multi-core arrangement. With current processing technology, the concentricity of the core hole can reach within 0.3 µm. Since the ceramic ferrule hole is slightly larger than the fiber diameter, when fixing the fiber with the ceramic ferrule using curing adhesive, the fiber can hardly be positioned exactly at the center, which also introduces a certain amount of eccentricity. The diameter of the ferrule hole is generally 0.5 µm or more larger than the fiber diameter, leading to an overall concentricity deviation (i.e., lateral misalignment) of 1-1.3 µm. As shown in Figure 1, this corresponds to an insertion loss of about 0.2 dB, which is the mainstream insertion loss range in the industry today. To reduce the insertion loss to less than 0.1 dB, the transverse misalignment needs to be controlled within 0.7 µm.
To reduce fiber optic connection loss, the first step is to minimize lateral misalignment. There are two main methods in the industry:
1. Through the tuning process, adjust all fiber core eccentricity positions to the fixed area of the connector.
2. Improve processing and assembly processes to enhance fiber core concentricity.
II. Tuning Process to Reduce Insertion Loss
The tuning process is a method for pre-assembled fiber optic connectors, which adjusts different core eccentricity positions to a single region to achieve mutual compensation of eccentric positions and reduce overall lateral misalignment. A typical pre-assembled ceramic ferrule consists of a ceramic tube and a tailstock (Figures 2 and 3), with concave-convex slots between the tailstock and the sleeve to fix the insert. According to TIA/EIA standard recommendations, the four slots in the tailstock are evenly spaced around the circumference. By rotating the insert, the eccentricity can be controlled within ±22.5° of the specified position (Key, also known as the locating key, see schematic marks in Figures 3 and 4), i.e., within ±45° of the eccentricity angle when two connectors are mated.
Figure 2 3D Drawing of a Typical Insert
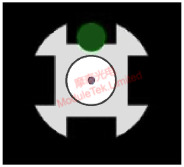
Figure 3 Typical Insert and Key (Green Dots)
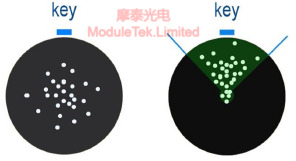
Figure 4 Eccentricity Distribution Area (Top) and Key Parameters (Bottom) After Tuning
Figure 4 illustrates the eccentricity region of the insert after the tuning process. The tuning effect is mainly described by the region angle H, maximum region radius F, and center region radius G. Table 1 lists the parameter values of different grades of inserts according to the IEC 61755 (2005) standard. Obviously, the more concentrated the eccentricity region (smaller H, F, and G values), the higher the core grade, the better the core concentricity, the less lateral misalignment occurs during connection, and the lower the corresponding insertion loss.
Table 1 Relationship Between Core Grade and Eccentricity Region Parameters (IEC 61755 (2005) Standard)
|
Ref
|
Units
|
Grade A
|
Grade B
|
Grade C
|
Grade D
|
||||||||||||
|
PC
|
APC
|
PC
|
APC
|
PC
|
APC
|
PC
|
APC
|
||||||||||
|
Min
|
Max
|
Min
|
Max
|
Min
|
Max
|
Min
|
Max
|
Min
|
Max
|
Min
|
Max
|
Min
|
Max
|
Min
|
Max
|
||
|
F
|
\
|
0
|
0.6
|
0
|
0.6
|
0
|
1.2
|
0
|
1.0
|
0
|
1.5
|
0
|
1.4
|
0
|
1.6
|
0
|
1.5
|
|
G
|
\
|
0
|
0.1
|
0
|
0.1
|
0
|
0.3
|
0
|
0.2
|
0
|
0.3
|
0
|
0.3
|
NA
|
NA
|
NA
|
NA
|
|
H
|
\
|
0
|
50
|
0
|
50
|
0
|
50
|
0
|
50
|
0
|
50
|
0
|
50
|
NA
|
NA
|
NA
|
NA
|
The tuning process can be performed by automated concentricity testing instruments, such as Norland's Centroc, Data-Pixel's Koncentrik, and Dimension Technology's Core Turner series. Insertion loss can be significantly reduced and kept within limits before and after tuning (see Table 1 and Figure 5):
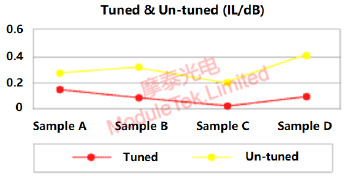
Figure 5 Typical Changes in Insertion Loss Before and After Tuning
III. Improving Core Concentricity of Pre-Assembled Inserts
Improving the core concentricity of pre-assembled ferrules by optimizing physical dimensions is the most fundamental way to reduce transverse misalignment. However, due to limitations in material processing technology, ferrule manufacturing processes, and fiber positioning control processes, producing products that exceed industry standards using this method requires ultra-precision controlled mechanical equipment, resulting in high costs. Only enterprises with a certain scale will consider this approach.
3.1 Ceramic Insert Manufacturing Process
Currently, there are various manufacturing processes for ceramic inserts. A typical method involves making a ferrule blank from zirconia material, forming a bore with a diameter of approximately 120 µm by injection molding, and then performing precision machining on the inner hole and outer diameter. During precision machining, the ferrule blank is threaded onto a special steel wire of varying thickness, and the bore is ground to 125 µm or other required values by rotating and moving the ferrule. The outer diameter is then repeatedly ground using a rotating device and a grinding wheel to improve concentricity. Currently, ceramic inserts with a concentricity of less than 1 µm can be achieved through this process.
To improve the concentricity between the inner hole and outer diameter of the insert, we can start from two aspects. First, improve the production accuracy of the ferrule blank—for example, use feedback on bore offset and straightness deviations to adjust the mold structure and correct the material channel structure, minimizing bore offset of the ferrule blank. Researchers from a company have tested that the bore diameter offset in the Z direction of the ferrule blank produced after mold adjustment can be controlled within 20 µm. Second, improve the precision of outer diameter (OD) processing—for example, optimize the guide wheel mechanism in grinding equipment, refine the chip removal groove, and reduce the impact of grinding heat and temperature on the product. The improved grinding equipment can control the overall coaxiality between the insert bore and outer diameter within 0.6 µm.
3.2 Core Assembly Process
This method—real-time concentricity detection via optical observation—has only begun to be tested and applied in recent years. It uses optical observation methods (such as magnified imaging and machine vision) to real-time detect the concentricity between the fiber and ferrule during the assembly and curing process, and adjusts the fiber core position in real time to achieve the highest possible concentricity. For example, researchers at the China Academy of Metrology have proposed a compact machine vision system (Figure 6), which, combined with a specific LED lighting scheme and edge detection algorithms, can quickly detect ferrule concentricity with a deviation of about 0.01 µm from the nominal parameter.
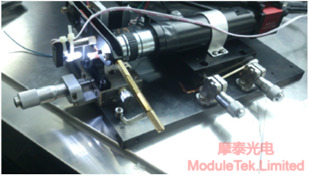
Figure 6 Machine Vision System for Fiber Optic Ferrule Concentricity Inspection
Although not yet widely used on a large scale, this method has the potential for real-time monitoring of the ferrule-fiber assembly process. The illumination and imaging do not require contact with the functional area of the end face, thus not affecting the assembly process. Additionally, the fast result feedback rate allows sequential adjustment of the core position in the insert to optimize the concentricity of pre-assembled fiber optic insert products. This method can be used to manufacture ultra-high concentricity fiber optic connections (e.g., 0.3 µm and below), which is close to the industrial limit.
Moduletek offers the products covered in the above application guide. Welcome to place your orders!
For further inquiries about the above content, please contact us at: sales@moduletek.com


